The Midwestern Higher Education Compact (MHEC) brings together leaders from 12 Midwestern states to strengthen postsecondary education, advance student success, and promote regional economic vitality.
MHEC programs and initiatives save member states and students millions of dollars annually through time- and cost-savings opportunities. MHEC research supports workforce readiness and improves the quality, accessibility, and affordability of postsecondary education. MHEC convenings bring together leaders and subject experts to share knowledge, generate ideas, and develop collaborative solutions.
One of four regional higher education compacts in the U.S., MHEC was authorized through legislation in 1991. Its contracts, research, programs, initiatives, and convenings are available to all public and private nonprofit institutions of higher education in the Midwest.
MHEC is governed by a 60-member commission, with five commissioners appointed from each of the 12 member states.
Member States
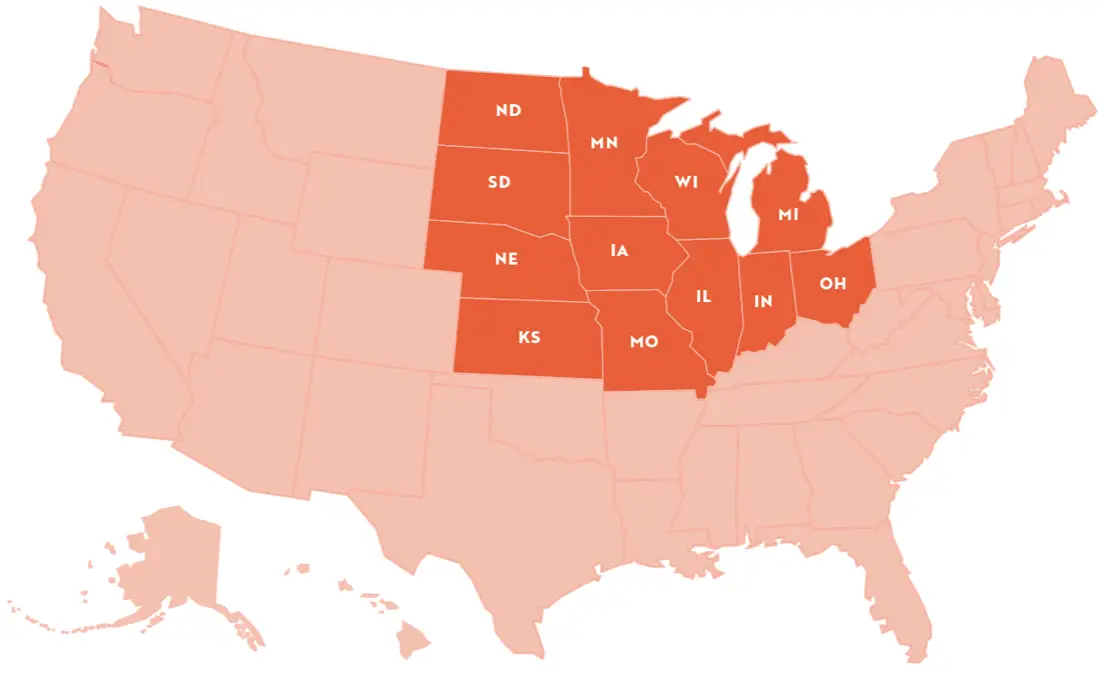
- Illinois
- Indiana
- Iowa
- Kansas
- Michigan
- Minnesota
- Missouri
- Nebraska
- North Dakota
- Ohio
- South Dakota
- Wisconsin
Mission
MHEC brings together Midwestern states to develop and support best practices, collaborative efforts, and cost-sharing opportunities. Through these efforts it works to ensure strong postsecondary educational opportunities for all.
Vision
To improve student success and regional economic vitality through collective problem-solving and partnerships that strengthen postsecondary education.
Who MHEC Serves
- Higher education system leaders
- State policymakers
- State legislators
- Students and families