

MHEC’s interactive dashboard offers key data to boost educational attainment.
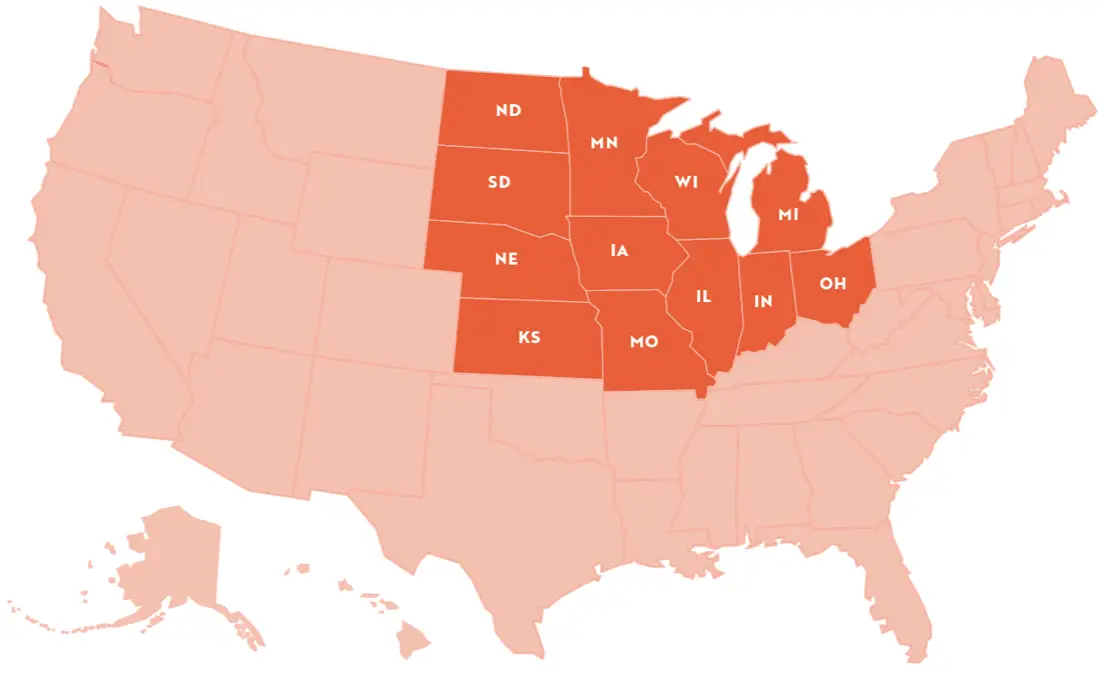
The Midwestern Higher Education Compact (MHEC) Interactive Dashboard provides data and key performance indicators relevant to the goal of improving educational attainment in the Midwest and across the nation. Indicators are organized within nine categories: Context, Preparation, Participation, Affordability, Health, Completion, Finance, Attainment, and Workforce. Several of these areas also portray a subcategory highlighting opportunity and achievement gaps by income, race, and ethnicity.